Getting It Right the First Time
To help us do this, we are committed to listening to the patient voice when looking at ways to improve our services.
‘Readmissions to hospital within 28 days of discharge’ is an indicator of how well we are achieving our objective to provide universal access to services that are coordinated and provide continuity of care.
By measuring and monitoring this indicator, the level of potentially avoidable hospital readmissions can be assessed in order to identify key areas for improvement. This in turn can facilitate the development and delivery of targeted care pathways and interventions, which can help to ensure effective restoration to health and improve the quality of life of Western Australians.
Unplanned and unexpected hospital readmissions within 28 days rates are provided for the following surgical procedures:
- knee replacement
- hip replacement
- tonsillectomy & adenoidectomy
- hysterectomy
- prostatectomy
- appendicectomy.
Measuring unplanned readmissions for selected surgical procedures
Readmission rate is considered a global performance measure, as it potentially points to deficiencies in the functioning of the overall healthcare system. Good intervention, appropriate treatment together with good discharge planning will decrease the likelihood of unplanned hospital readmissions. A low unplanned readmission rate suggests that good clinical practice is in operation. These readmissions necessitate patients spending additional periods of time in hospital as well as utilising additional hospital resources.
The benchmark in each of the following categories is based on the best state-wide result within the five calendar years from 2012 – 2016.
Knee replacement
How do we measure up
The graph below shows the unplanned readmissions for selected surgical procedures rate for Armadale Health Service.
Chart: Unplanned readmissions of patient discharged following management of knee replacement

What the figures mean
This indicator counts the number of times patients have needed re-admission to hospital within 28 days of discharge after having had a knee replacement.
The benchmark is less than or equal to 21 readmissions for every 1,000 discharges, or about 1 re-admission in 47 knee replacements. A rate lower than the benchmark is desirable.
The rates for AHS were lower than the benchmark for the last four quarters.
Hip replacement
How do we measure up
The graph below shows the unplanned readmissions for selected surgical procedures rate for Armadale Health Service.
Chart: Unplanned readmissions of patient discharged following management of hip replacement

What the figures mean
This indicator counts the number of times patients have needed re-admission to hospital within 28 days of discharge after having had a hip replacement.
The benchmark is less than or equal to 19.4 readmissions for every 1,000 discharges, or about 1 re-admission in 52 hip replacements. A rate lower than the benchmark is desirable.
The rates for AHS were lower than the benchmark in two of the last four quarters. While these results represent very small case numbers, several quality improvement actions have been identified from individual case reviews.
Tonsillectomy and adenoidectomy
How do we measure up
The graph below shows the unplanned readmissions for selected surgical procedures rate for Armadale Health Service.
Chart: Unplanned readmissions of patient discharged following management of tonsillectomy and adenoidectomy.

What the figures mean
This indicator shows the rate of unplanned readmissions of patients within 28 days of discharge after having a tonsillectomy and adenoidectomy at AHS.
The benchmark is less than or equal to 84.4 readmissions for every 1,000 discharges, or about 1 re-admission in 12 tonsillectomy/adenoidectomy. A rate lower than the benchmark is desirable.
The rates for AHS were lower than the benchmark in three of the last four quarters. These results represent very small case numbers, patients are often managed conservatively, being readmitted as a precaution with minor post-operative bleeding.
Hysterectomy
How do we measure up
The graph below shows the unplanned readmissions for selected surgical procedures rate for Armadale Health Service.
Chart: Unplanned readmissions of patient discharged following management of hysterectomy.

What the figures mean
This indicator counts the number of times patients have needed re-admission to hospital within 28 days of discharge after having had a hysterectomy.
The benchmark is less than or equal to 45.8 readmissions for every 1,000 discharges, or about 1 re-admission in 22 hysterectomies. A rate lower than the benchmark is desirable.
AHS results have been lower than the benchmark in three of the last four quarters. While these results represent very small case numbers, several quality improvement actions have been identified from individual case reviews.
Prostatectomy
How do we measure up
The graph below shows the unplanned readmissions for selected surgical procedures rate for Armadale Health Service.
Chart: Unplanned readmissions of patient discharged following management of prostatectomy.

What the figures mean
This indicator counts the number of times patients have needed re-admission to hospital within 28 days of discharge after having had a prostatectomy.
The benchmark is less than or equal to 40 readmissions for every 1,000 discharges, or about 1 re-admission in 25 prostatectomies. A rate lower than the benchmark is desirable.
AHS results have been lower than the benchmark in two of the last four quarters. While these results represent very small case numbers, several quality improvement actions have been identified from individual case reviews.
Appendicectomy
How do we measure up
The graph below shows the unplanned readmissions for selected surgical procedures rate for Armadale Health Service.
Chart: Unplanned readmissions of patient discharged following management of appendicectomy.

What the figures mean
This indicator counts the number of times patients have needed re-admission to hospital within 28 days of discharge after having had appendicectomies.
The benchmark is less than or equal to 29.7 readmissions for every 1,000 discharges, or about 1 re-admission in 34 appendicectomies. A rate lower than the benchmark is desirable.
AHS results have been below the benchmark in three out of the last four quarters. All cases are reviewed by AHS to identify common factors that can be addressed to minimise future unplanned readmissions.
Listening to and acting on feedback from our patients, their families and their carers about our health services is one of the most important aspects of delivering high quality care.
Complaints about provision of health care services can be made by anyone who has contact with our services. People who complain often have some basic expectations, they want to:
- be heard and understood
- be respected
- be taken seriously
- be given support or assistance if required
- have their concerns dealt with effectively and efficiently
- be informed of the process, progress, findings and outcome
- have appropriate action taken as a result of their complaint.
Communication issues underpin most complaints we receive, and most people who submit a complaint are simply looking for an explanation or apology. Another common motivation behind complaints is to prevent the same thing happening to others. This is why acknowledging complaints promptly and letting people know what's been done to prevent it happening again is so important.
The complaint management process is not intended to apportion blame but strives to resolve the complaint, if possible, and identify any aspects of service delivery which require change in order to effect improvement.
Measuring complaints numbers and actions taken
The Health and Disability Services Complaints Act 1995 and Regulations 2010 legislate for the annual provision of information relating to complaints received by the health service provider, and action taken, to the Health and Disability Services Complaints Office.
The key issues associated with a complaint about our health service are determined by EMHS staff in discussion with the person making the complaint. Identifying the issues in the complaint provides for effective resolution and allows all parties to have an understanding of the issues raised. Each complaint received must have at least one complaint issue identified, with the possibility for multiple issues to be identified in one complaint. Similarly each complaint will have at least one resolution achieved, with the possibility of multiple resolutions being achieved for one complaint.
Complaints rate
How do we measure up
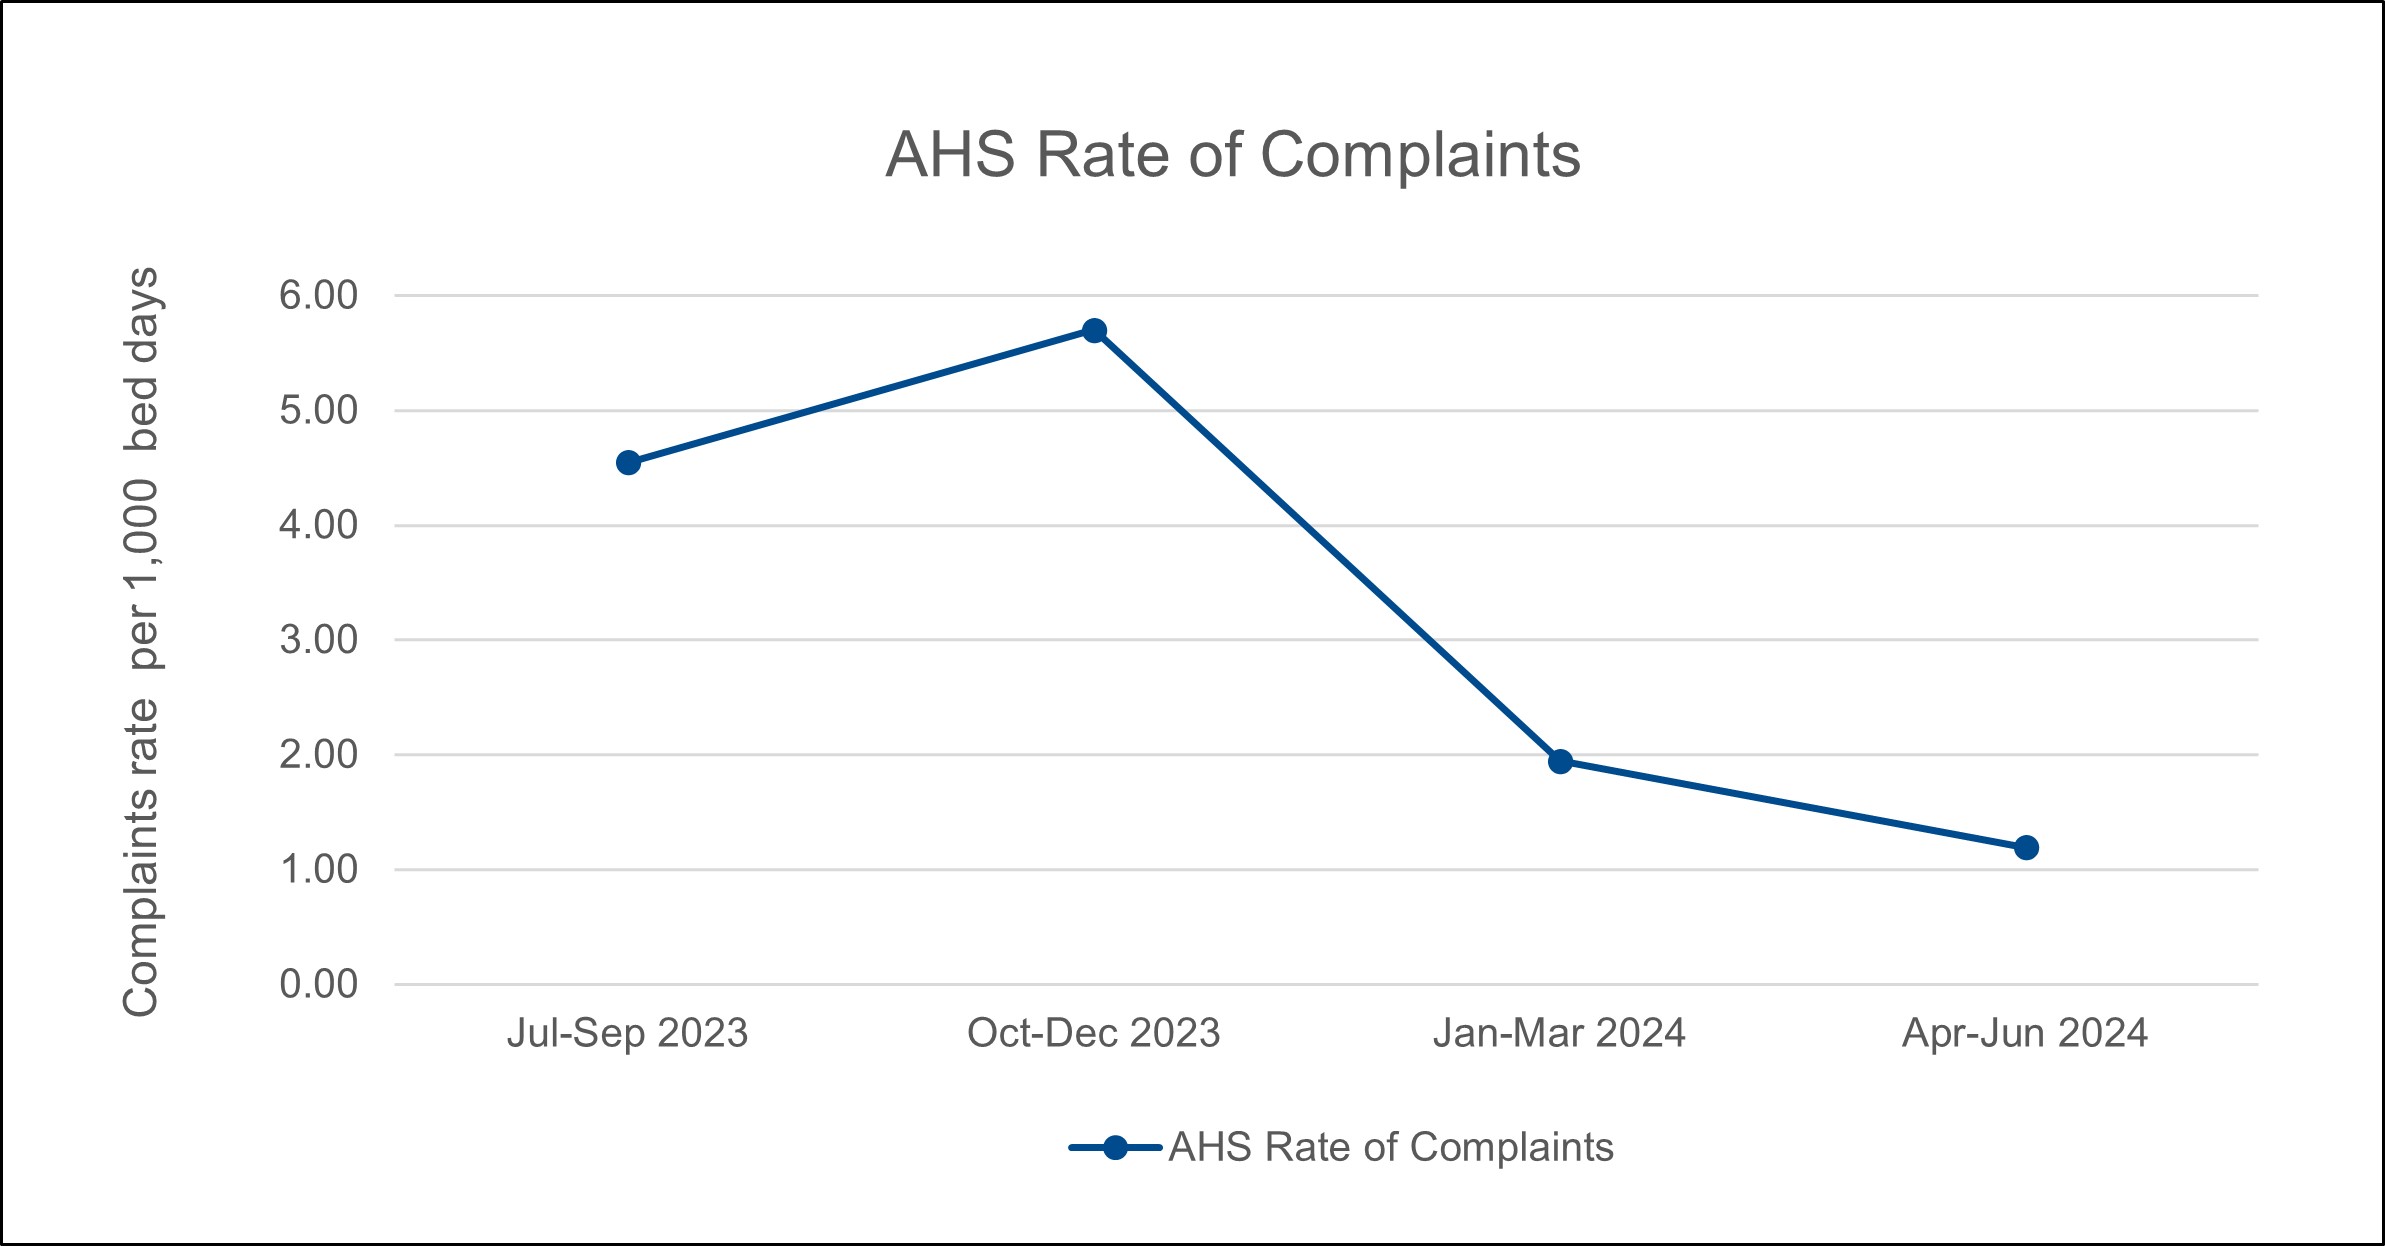
The graphs below show the combined complaints numbers for Armadale Health Service.
Chart 1: Complaints rate per 1,000 bed days.

What the figures mean
This graph shows the rate of complaints for AHS for the period July 2023 to June 2024. AHS encourages consumers to provide feedback on the care they receive and uses the feedback to continuously learn and improve the services they deliver.
Complaint issues
How do we measure up
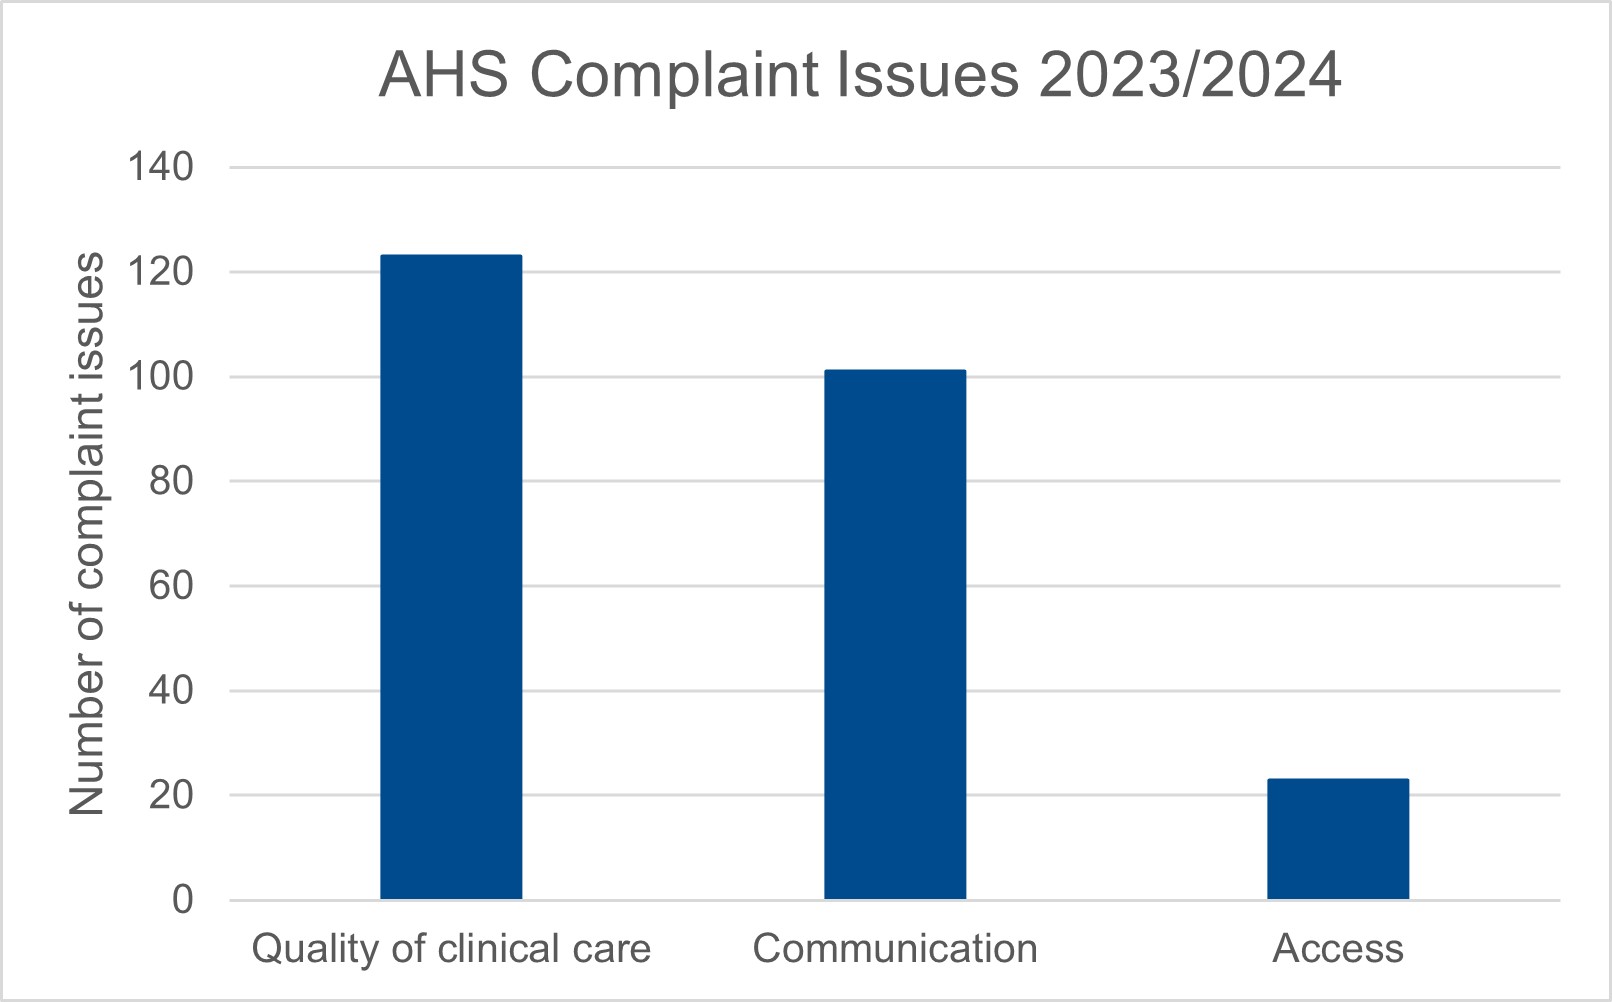
The graph below shows the combined ‘top three’ categories of complaint issues for Armadale Health Service.
Chart 2: ‘Top three’ categories of complaint issues.

What the figures mean
The three most common categories of complaint issues were ‘Quality of clinical care’, ‘Communication’ and ‘Access’. Between them, these accounted for 78% of all issues.
Complaint resolutions
How do we measure up
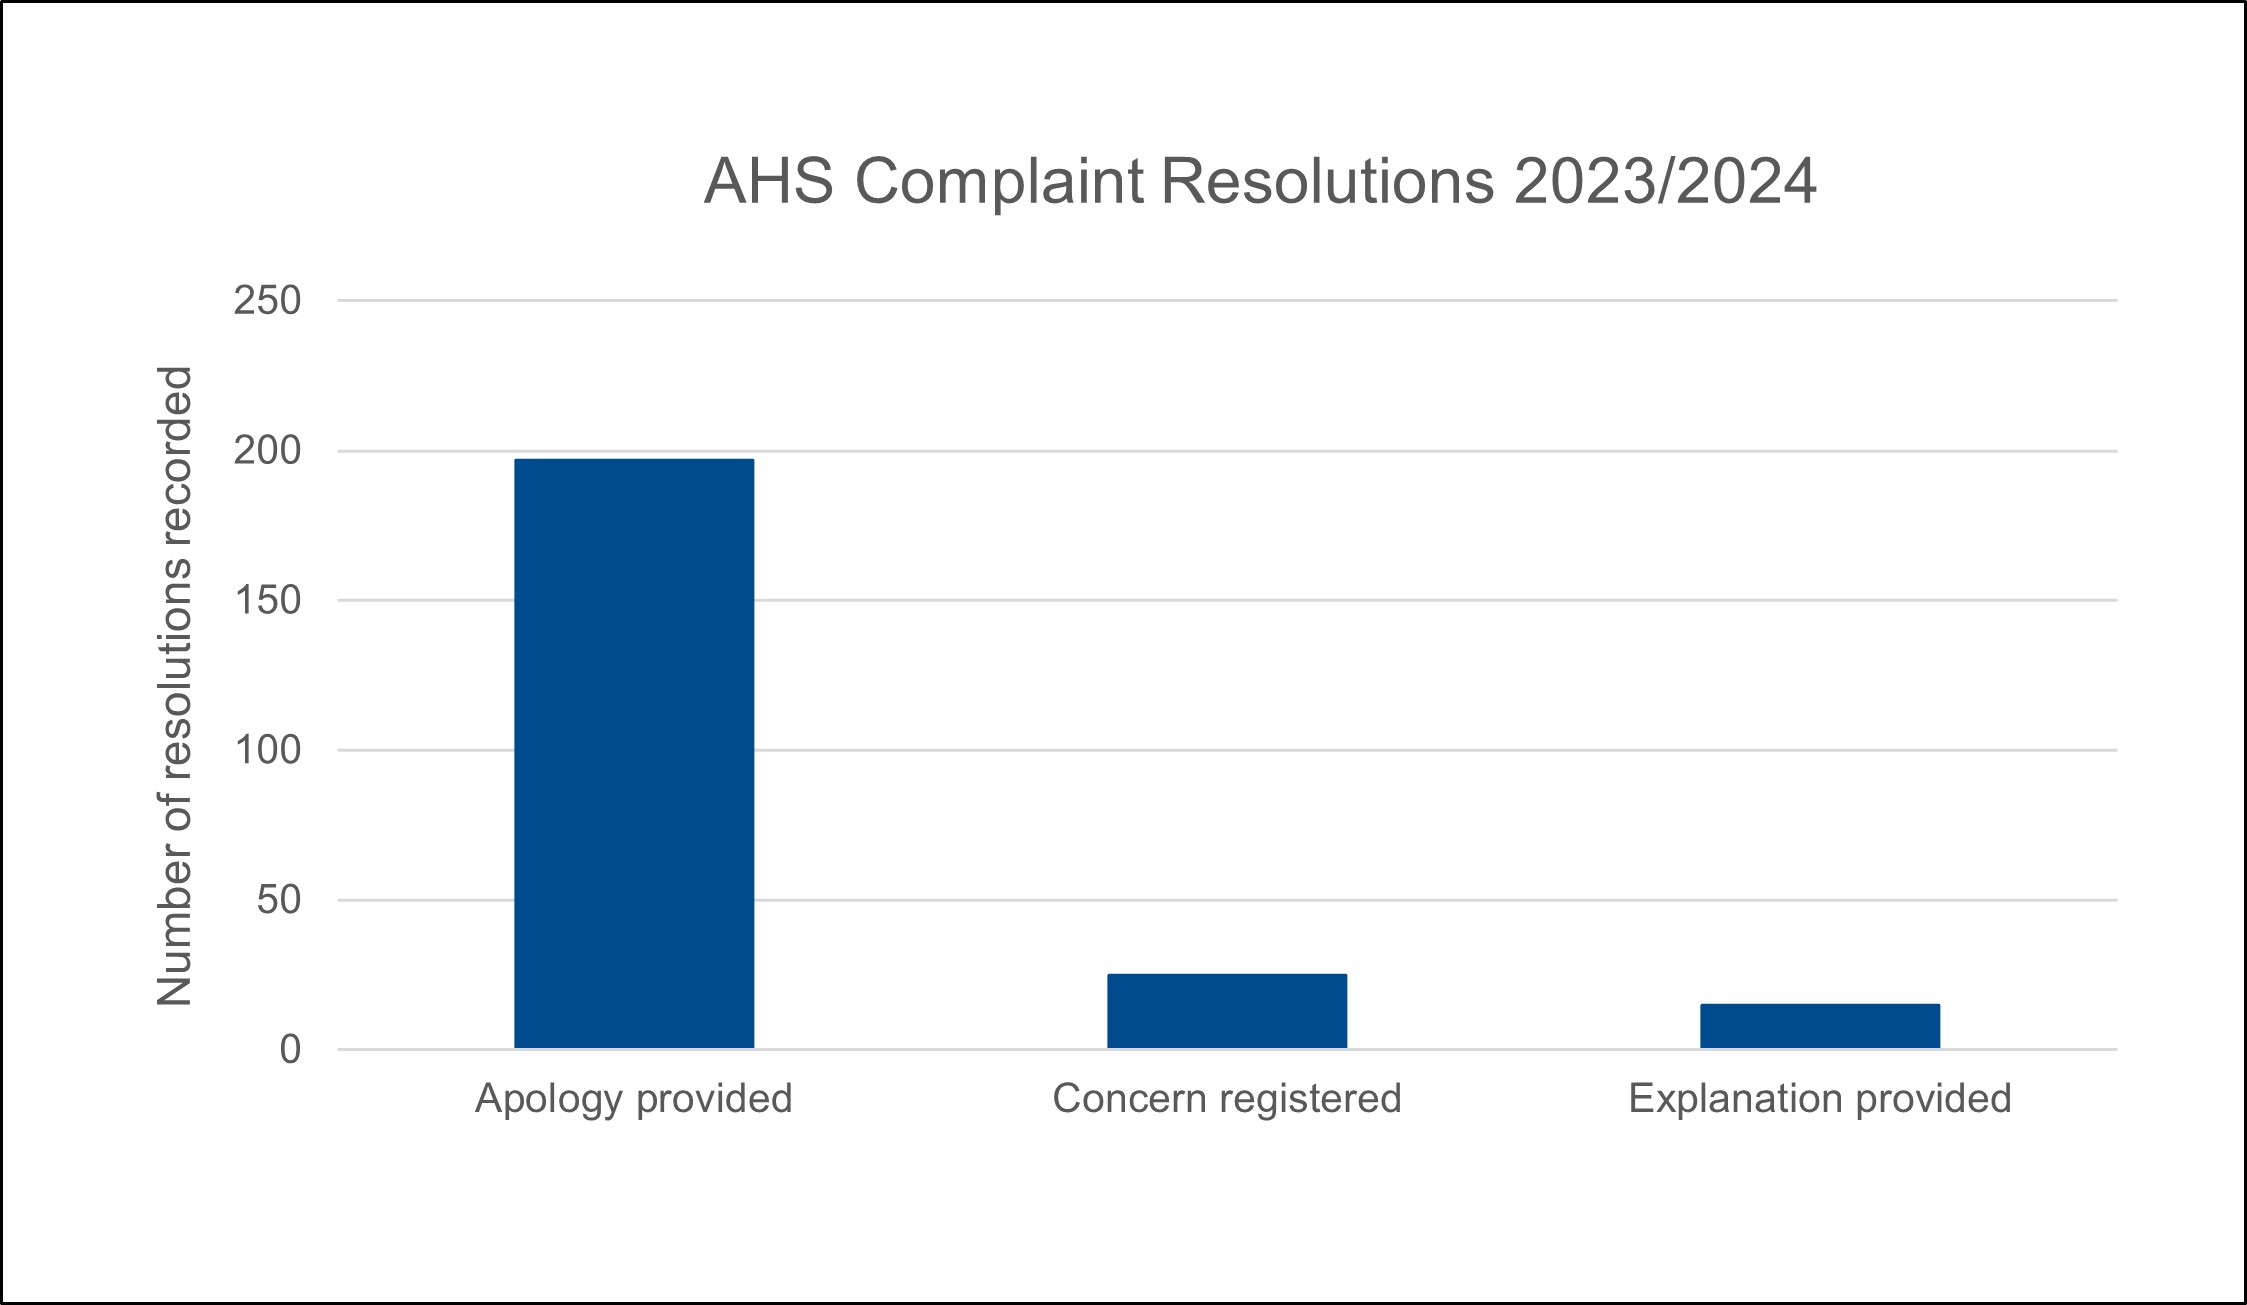
The graph below shows the combined ‘Top three’ resolutions to complaints for Armadale Health Service.
Chart 3: Complaint resolution.

*Note: One complaint may have more than one resolution, so the count of resolutions may be greater than the number of complaints.
What the figures mean
The top three complaint resolutions for 2023/2024 were 'Apology provided', 'Concern registered' and 'Explanation provided'.

